Jake Coolidge makes maps for the web and print
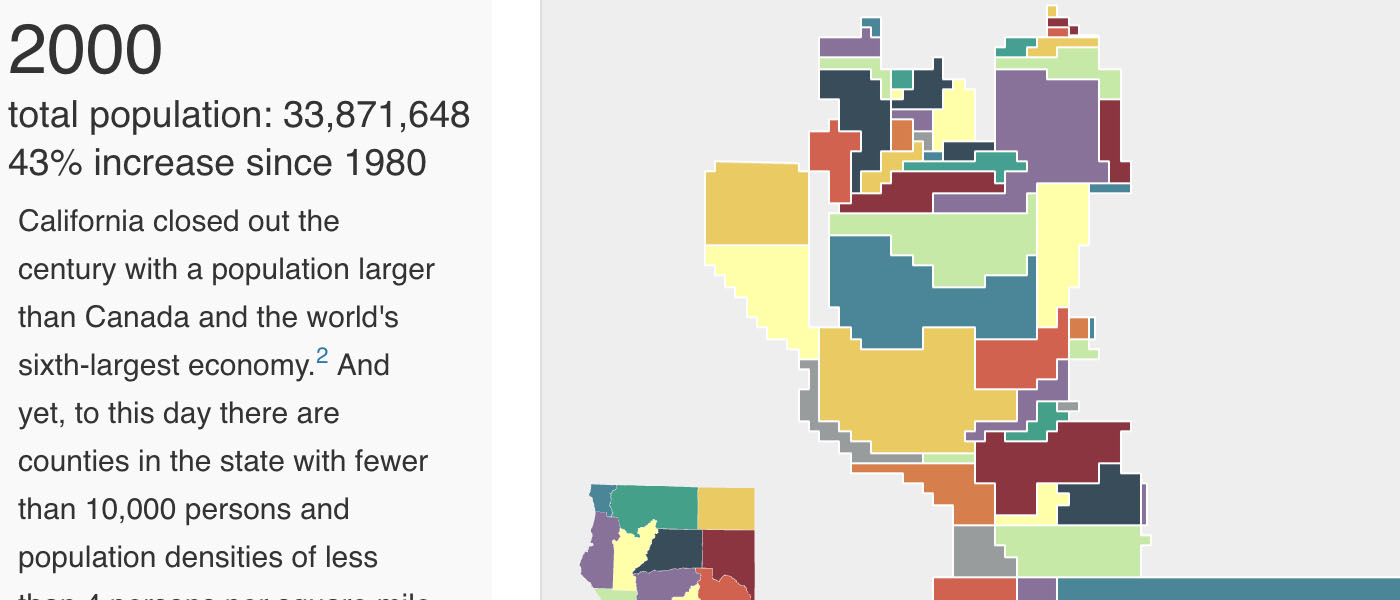
A Century of Growth: California Population, 1900–2000
Interactive cartogram series drawn using Adobe Illustrator/Avenza MAPublisher and rendered using Leaflet.js. Based on US Census data.
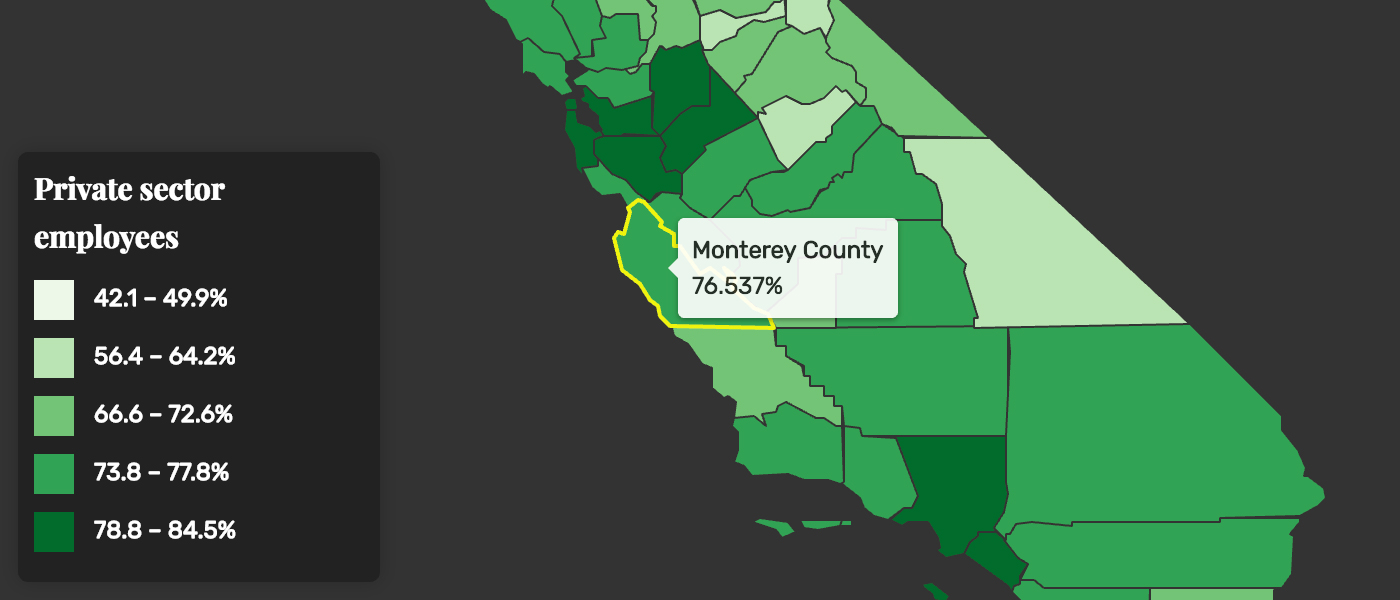
View ProjectLabor in California
Interactive choropleth shows employment in California by sector, rendered using Leaflet.js. Uses data from American FactFinder and the US Census.
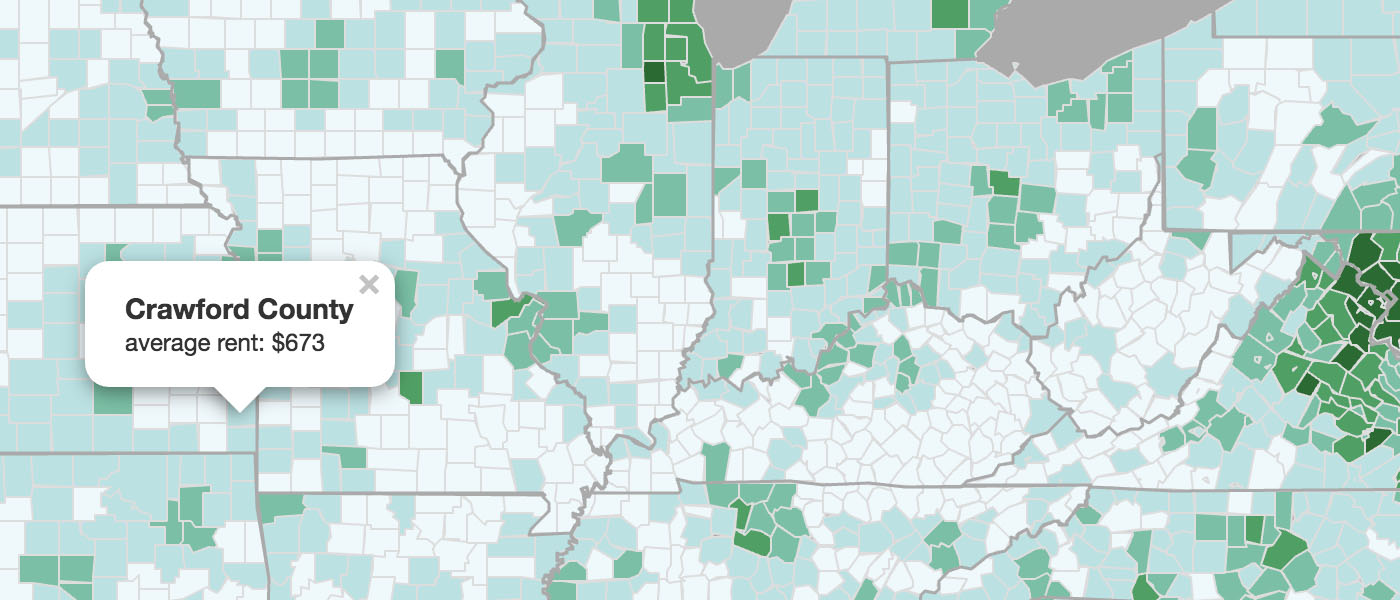
View ProjectRental Prices in the US
Choropleth map depicting average rents by county, rendered using Leaflet.js. Uses data from American FactFinder and the US Census.
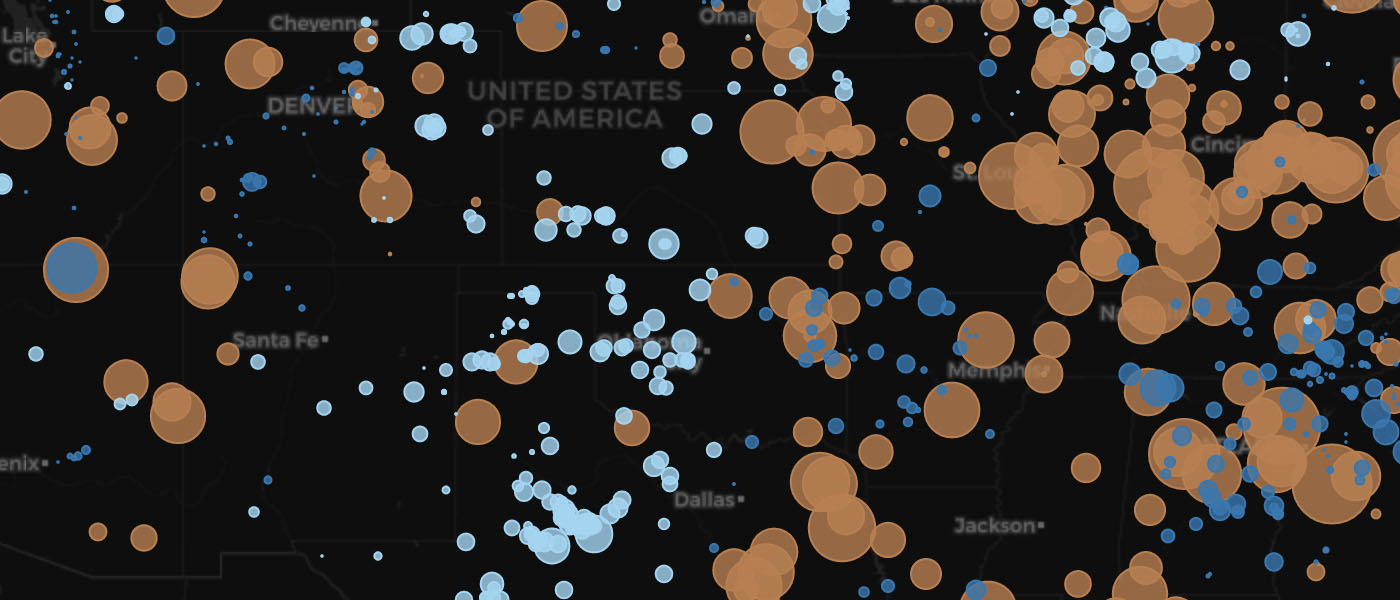
View ProjectPower Plants in the US
Proportional symbol map depicting electric power production in the US by coal, wind, and hydro (or water) power. Rendered using Leaflet.js. Uses data acquired from the US Energy Information Administration.
View ProjectA Hometown Map of Seattle
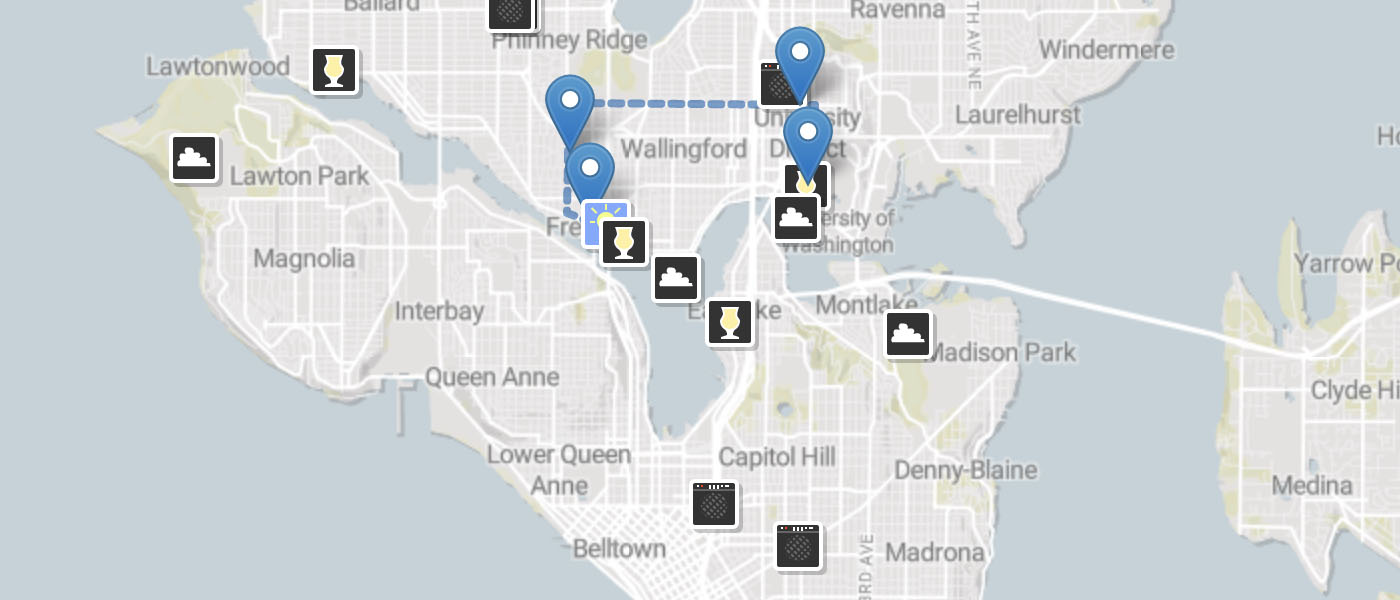
A more whimsical and personal depiction of Seattle, depicting several types of places I've frequented in the Emerald City over the years. Rendered using Leaflet.js. Custom basemap tiles designed using Mapbox Studio and custom symbols designed using Adobe CC.
View ProjectBreweries in North America and Hawaii
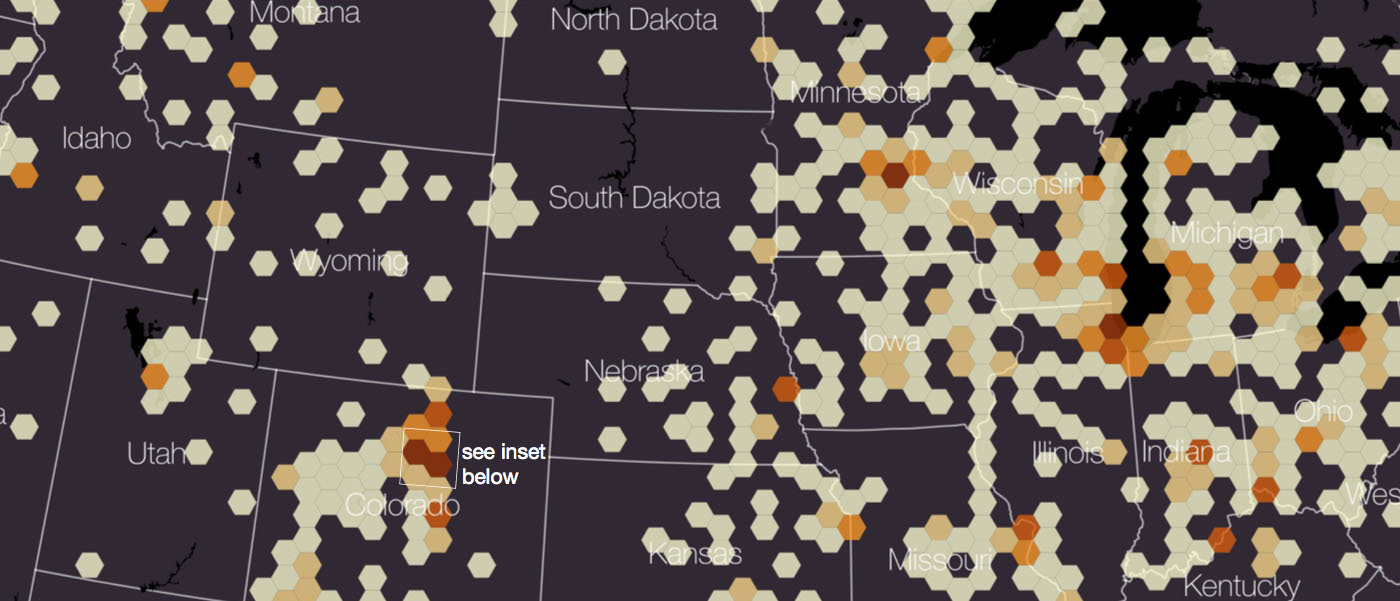
A large-format print map that depicts brewery density using a hex-bin technique. The leading metropolitan area for brewing, Denver-Boulder, Colorado, is featured in an inset. Map compiled and composed using QGIS.
View ProjectAbout Jake Coolidge
I'm a cartographer, geographer, and artist currently based in the Denver metro area. I have over eight years experience creating maps for a diverse range of clients and am currently incorporating front-end development techniques into my skill-set.
Skills
- Open-source geospatial software: QGIS, PostGIS
- Other cool geo stuff: Avenza MAPublisher, JOSM, CARTO, Mapbox Studio and Studio Classic, Fulcrum, ArcGIS, Fulcrum
- HTML, CSS, JavaScript
- Graphic Design: Adobe Illustrator, Photoshop, InDesign, Sketch, Inkscape
- Word processing and spreadsheets: MS Office, Google Drive
